
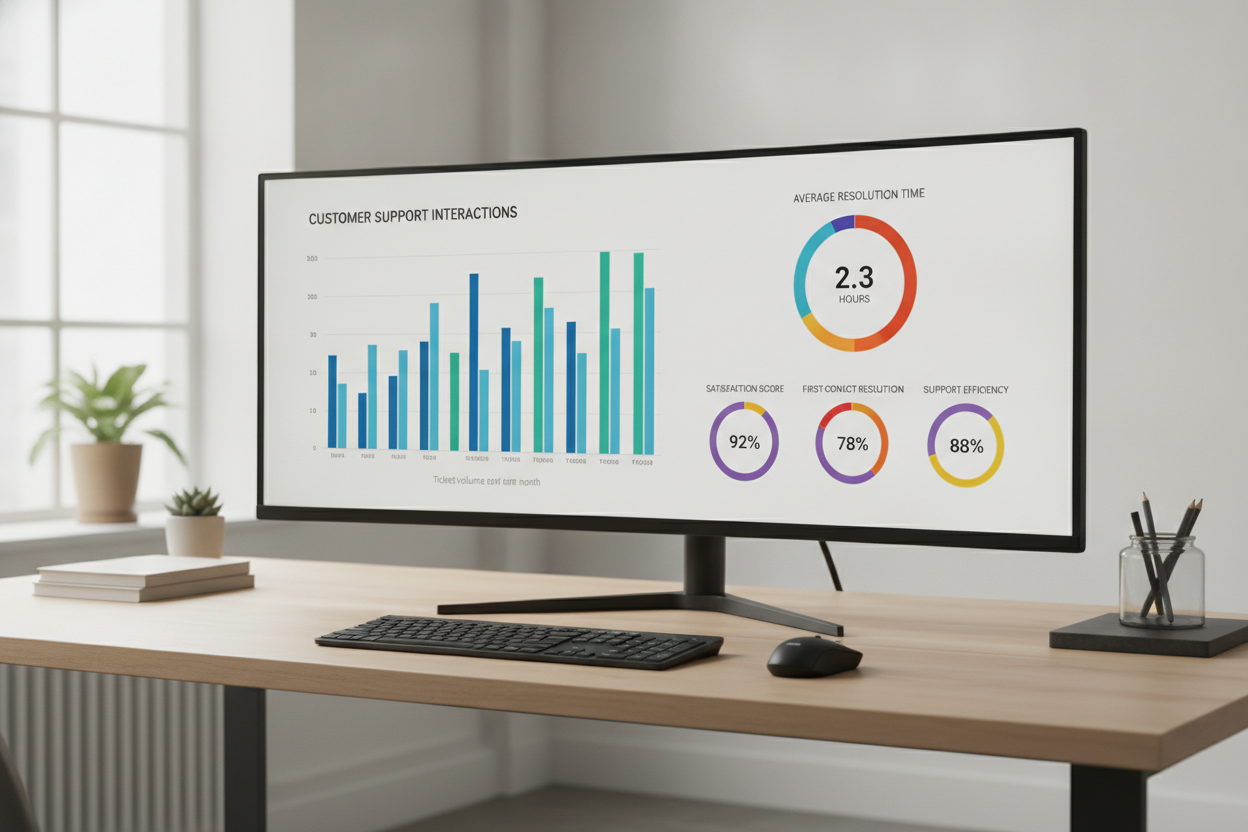
Most SaaS companies measure support automation by counting the tickets that never get created. That single metric, ticket deflection rate, has become the default scorecard for chatbots, knowledge bases, and self-service portals. But deflection alone tells you almost nothing about whether your automation is actually working; a customer who rage-quits your help widget and calls their account manager instead has technically been "deflected," and that is the opposite of success.
The real measure of support automation effectiveness combines deflection volume with resolution quality, customer effort, and downstream retention signals. Getting this right means building a measurement framework that tracks what happened after the bot answered, not just whether the bot answered at all.
The obsession with deflection rate started in the contact center world, where every call costs between $6 and $12 to handle and the math on diverting volume is straightforward. SaaS companies inherited this metric without adjusting for the fact that their customers interact with support differently. A B2B customer submitting a billing question is not the same as a consumer checking an order status. The cost of mishandling that interaction is not $8 in agent time; it is a renewal worth five or six figures. When you optimize purely for fewer tickets created, you create incentives that actively harm the customer relationship. Bots get trained to close conversations quickly. Knowledge base search gets tuned to surface any article rather than the right one. Self-service flows get designed to make it hard to reach a human, which is the single fastest way to tank your NPS with mid-market accounts.
A better starting point is what I call the resolution completeness rate: of the interactions handled entirely by automation, what percentage actually resolved the customer's issue without requiring follow-up contact within 72 hours? This metric forces you to track the customer's journey beyond the automated interaction. If someone chats with your bot about a billing discrepancy, gets a canned answer about where to find invoices, and then emails your finance team two days later about the same problem, that is not a successful deflection. It is a delayed escalation with extra friction added. Measuring this requires connecting your automation platform's conversation logs to your ticketing system, which sounds obvious but surprisingly few companies do it. The 72-hour window matters because shorter windows miss the customers who give up temporarily before trying again, and longer windows introduce too much noise from unrelated contacts.
Pull Quote: "If a customer chats with your bot and then emails your team two days later about the same problem, you did not deflect a ticket. You delayed one."
The second metric worth tracking is customer effort score (CES) specifically for automated interactions. CES has been a standard support metric for years, but most companies only measure it on human-handled tickets. Applying it to bot interactions and self-service flows reveals a different picture entirely. You can collect this with a single post-interaction survey question: "How easy was it to resolve your issue?" on a 1-to-7 scale. The benchmarking data from the industry suggests that automated interactions should score within 0.5 points of human-handled interactions on CES to be considered effective. If your bot scores a 3.2 while your agents score a 5.8, your automation is technically deflecting tickets while making customers work harder for worse answers.
There is a third layer that most teams miss entirely: the impact of automation on the conversations that do reach human agents. Good automation should make human-handled tickets faster and easier to resolve, not just fewer. When a bot collects context, authenticates the user, identifies the product area, and routes intelligently before handoff, the agent starts the conversation with information instead of spending the first three minutes asking diagnostic questions. Track your average handle time and first-contact resolution rate on escalated tickets separately from tickets that came in without any bot pre-processing. If your automation is working well, escalated tickets should actually resolve faster than tickets submitted directly to the queue, because the bot has already done triage.
| Metric | What It Measures | Target Range |
|---|---|---|
| Deflection Rate | % of potential tickets handled without human involvement | 30%-50% (varies by product complexity) |
| Resolution Completeness | % of deflected interactions with no follow-up contact within 72 hours | Above 85% |
| Automated CES | Customer effort score on bot/self-service interactions | Within 0.5 points of human CES |
| Escalation Handle Time | Average handle time for tickets escalated from automation | Below direct-submission handle time |
| Automation-Correlated Churn | Churn rate among accounts with high automation-only support exposure | Equal to or below overall churn rate |
That last row in the table is the metric nobody wants to look at: whether customers who interact primarily with automation churn at different rates than customers who interact with humans. This requires cohort analysis, not a simple report. Segment your customer base by the percentage of their support interactions that were handled entirely by automation over the past six months, then compare renewal and expansion rates across segments. If your highest-automation cohort shows meaningfully higher churn, you have a problem that your deflection rate dashboard will never reveal.
Running this analysis at one company I worked with uncovered a pattern that should have been obvious in retrospect. Customers in the "80%+ automated" cohort were not churning because the bot gave bad answers. They were churning because they had lost all sense of human connection to the company. Their account manager checked in quarterly, the bot handled everything in between, and when renewal came up they felt like they were paying for software, not a partnership. The fix was not less automation; it was adding a trigger that flagged accounts with zero human support interactions in 60 days for a proactive check-in from CS. The automation kept working. The relationship gap got filled.
This connects to a broader principle about how automation fits into customer success strategy. The best implementations treat AI support not as a replacement channel but as a first layer that makes the entire support operation smarter. Platforms that take this approach, such as Aigotchu, are designed around per-conversation pricing rather than per-seat licensing, which changes the economics in a useful way: you pay for actual automation usage rather than buying capacity you may not need, and there is no financial penalty for letting conversations escalate to humans when they should. That pricing model aligns the vendor's incentives with yours, because a conversation that escalates is one that did not generate full value for either party.
Building your measurement framework does not require a data engineering team or a six-month BI project. Start with four data connections: your automation platform's conversation logs, your ticketing system, your CRM's account records, and a one-question post-interaction survey. The conversation logs give you deflection volume and resolution data. The ticketing system gives you follow-up and escalation patterns. The CRM gives you the account-level context to run cohort analysis on churn. The survey gives you effort scores. Most modern support tools can export this data via API, and even a well-structured spreadsheet can handle the analysis for companies under 500 accounts.
The cadence matters too. Weekly reviews of deflection rate and resolution completeness catch operational issues, like a knowledge base article that is surfacing for the wrong queries or a bot flow that is looping customers. Monthly reviews of CES trends and escalation quality catch systematic problems with how automation is trained. Quarterly cohort analysis on churn correlation catches strategic misalignment between your support model and your retention goals. Trying to do all of this daily creates noise. Doing it only quarterly means you discover problems four months after they started costing you customers.
One thing worth calling out: the quality of automated responses matters far more than the speed. Many teams optimize their bots for response time, aiming for sub-second answers, when the actual driver of customer satisfaction in automated support is accuracy and completeness. A bot that takes four seconds to return a precise, contextual answer outperforms one that instantly returns a generic FAQ link. If your automation platform supports it, track answer relevance as a distinct metric from answer speed. Some companies do this by having QA reviewers score a random sample of 50 automated conversations per week on a three-point scale (resolved, partially resolved, not resolved), which takes about two hours and provides more actionable data than any dashboard.
Pull Quote: "A bot that takes four seconds to return a precise answer will always outperform one that instantly returns a generic FAQ link."
The companies that get the most out of support automation are the ones that treat measurement as a feedback loop, not a report card. Every metric should connect to a specific action: if resolution completeness drops below 85%, someone reviews the failing conversation flows. If automated CES diverges from human CES by more than a point, someone audits the bot's response quality. If the high-automation cohort shows elevated churn signals, someone adjusts the proactive outreach triggers. Measurement without action is just dashboard tourism, and most SaaS operations teams already have enough of that.
The goal is not to deflect as many tickets as possible. The goal is to resolve customer issues in the fastest, lowest-effort way available, whether that involves a bot, a human, or a combination of both, and then prove with data that you are actually doing it. Build the scorecard, run it consistently, and let the numbers tell you where your automation is genuinely helping and where it is just hiding problems behind a lower ticket count.
What is a good ticket deflection rate for SaaS companies?
Deflection rates vary significantly by product complexity and customer segment, but most mature SaaS support operations see effective deflection between 30% and 50%. More important than hitting a specific percentage is ensuring that deflected interactions actually resolve the customer's issue, which is why resolution completeness rate (targeting above 85%) should always be tracked alongside raw deflection volume.
How do you measure whether a chatbot is actually resolving issues?
Track resolution completeness by monitoring whether customers who interact with the bot submit a ticket or make follow-up contact within 72 hours about the same issue. Combine this with a post-interaction customer effort score survey (a single "How easy was it to resolve your issue?" question) and periodic QA reviews of a random sample of automated conversations. These three signals together give you a reliable picture of actual resolution quality.
Can support automation increase churn?
Yes, if implemented without measurement guardrails. Customers who exclusively interact with automation can lose their sense of partnership with your company, even if individual bot interactions are technically successful. Run quarterly cohort analysis comparing churn rates among high-automation accounts versus accounts with mixed human and automated support. If you see divergence, add proactive human check-in triggers for accounts that have gone 60 or more days without a human support interaction.
What metrics should I track weekly versus quarterly for support automation?
Track deflection rate and resolution completeness weekly to catch operational problems like broken bot flows or misconfigured knowledge base routing. Review customer effort scores and escalation handle times monthly to identify systematic training gaps. Run churn correlation cohort analysis quarterly to detect strategic misalignment between your automation model and customer retention outcomes. Trying to review everything daily creates noise that obscures real trends.
How does per-conversation pricing change support automation economics?
Per-conversation pricing, as used by platforms like Aigotchu, aligns costs with actual automation usage rather than charging for seat licenses regardless of volume. This means you pay proportionally to the value delivered, and there is no financial disincentive to letting complex conversations escalate to human agents when automation cannot fully resolve them. It also makes ROI calculation more straightforward: compare per-conversation cost against your average cost-per-ticket for human-handled interactions, adjusted for resolution quality differences.
